|
COMPARISON: INDIA & CHINA
|
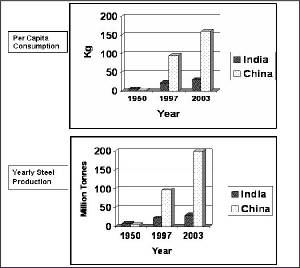
| Chart 3 India and China, a comparison. |
A
simple comparison of just the per capita steel consumption and the annual steel production is depicted for China
and India in Chart 3. The chart indicates
that while India & China
were at nearly the same level of steel consumption and production in 1950, India
remained mostly stagnant whereas China
went about industrialisation and development with greater determination. India
took noticeable steps only in the past 5-6 years. Here too, in the period of 1997 to 2003 per capita steel consumption in
China grew from 95 kg to 160 kg whereas the corresponding increase in India was 22 to 29 kg – most of it in 2001 to 2003.
China’s steel production increased by 105 mT from 95 mT in 1997 to 200 mT in 2003 while the corresponding rise in India
was only from 23 mT to 30 mT.
The
years from 1947 to 1997 are often regarded as the years of stagnancy in India.
Analysis of the reasons for the same would be meaningless and one must instead look forward to the years ahead and ‘catch-up’.
One notices the ‘intent’ on the part of the government to set right matters of nationwide development and we seem
to be on the right track at last. The steel industry and the citizens of India
can look forward to exciting years until 2020.
There
is no doubt that India will strive to achieve the status of a global economic and industrial power
by 2020s – and will become one. While most people in the steel industry, given India’s past track record, believe that the Joint Planning Committee target
of an increase of 70mT to 100 mT by 2018 is not attainable this writer opines that
this is rather conservative.
Political
compulsions due to the aspirations of the neglected majority will not permit just a few pockets of development. One foresees,
irrespective of the party in power at the Centre, that Government policies will lay stress on development of the vast areas
that have hitherto been neglected for over 55 years – alongside the liberalisation and open markets policy of recent
years. Infrastructure improvement across the country is a prime requisite to further development. For this, India will necessarily need to reach a per capita steel consumption
of at least 100 kg, if not more, by 2020. The ratio of long to flat products will also be set right to about 55% long and
45% flat. It is unlikely that past mistakes will be repeated.
With
an estimated population of around 1.4 billion in 2020, this level of consumption will mean a steel requirement of about 140
million tonnes per year – or an increase of 110 mT in 16 years (2005-2020) from the current level. This is definitely
feasible if one considers that China increased its production by 70 mT (130 to 200 mT) in 4 years from 2000 to 2003.
India can do it too, and will, even though
it involves an investment of about Rs 300,000 crores in 16 years. If
we do not achieve this production level, massive imports will surely be resorted to, because development is not going to stop
merely because the steel industry is not up to the challenge. It is entirely up to the industry.
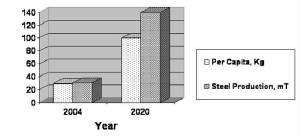
This
estimate is shown in Chart 4.
|
| Chart 4: Projections for 2020 |
The
55% share of long products amounts to 77 mT in 2020 with the balance 65 mT to be accounted for by flat. Out of 77 mT long
products, the requirement of steel reinforcement bars (rebars) will be about 35 mT
or a five fold jump from the present level of 6.5 - 7 mT. Special stress will therefore be on Rebar Mills. This has traditionally
been a neglected area and a study of the small rebar mills currently being set up reveals that even today proper planning
is not exercised. This is a cause for great concern and money will surely have to be spent in a better manner as large amounts
are involved.
Since
infrastructure will play an important role in our quest for development it is imperative that we have a proper policy and IS code in place at the earliest – one which takes into account the local needs.
|